
When we arrived in Boston in April 2011, we were told that a pretty rough winter with a lot of snow had just ended. We prepared ourselves to go through some hard times come December or January, but we proudly vanquished our first winter in Boston, 2011-2012, patting ourselves on the back saying “we can totally do this, it’s not as bad as they say”. Still, I remember feeling some excitement the day we reached a minimum temperature of -14°C (or 7°F), and thinking “wow, -14°C, this is something!”.
Well, wait a second, myself of January 2012.
That winter was on the milder side, and every year since then has been getting a little bit worse. Until this year, where the weather apparently just decided to give us a run for our money.
By now, you’ve probably heard about the ridiculous amount of snow that has been piling up around Boston, and in particular in my driveway, through storms after storms. Always on weekdays, because you know, it wouldn’t be fun if the kids didn’t have to skip school and be entertained at home. At this point, Boston is at 104.1″ (2.64 meters…) and, guess what, it’s snowing right now! This is already the second snowiest season of all time, and we should hit number 1 easy peasy in the next few days.
So snow is one thing, but I got to think again about January 2012’s me clamoring “wow, -14°C, this is something!”. As I was watching the weather reports recently, I felt like I was seeing a lot of pretty low numbers, with minus eighteens here and there (that’s without the windchill…), to the point where everybody just became pretty casual about it. So I decided to look it up, to make sure that my 2012 utter shock at the -14°C mark was a mere lack of truly Bostonian perspective and experience.
To do so, I requested the relevant data from the National Climatic Data Center (NCDC), and did a simple analysis of the minimum and maximum temperatures at Boston Logan International Airport (the reference weather station in Boston) from January 5 to February 26, each year from 2012 to 2015. The range is pretty arbitrary: January 5 is the day we came back from France this year, and February 26 is the day of the latest available data. So, basically, I’m trying to compare the pain we (me and my family, completely selfishly) have endured so far this winter to that of past years.
Without further adue, here is an illustration of the minimum temperatures that we’ve been getting:
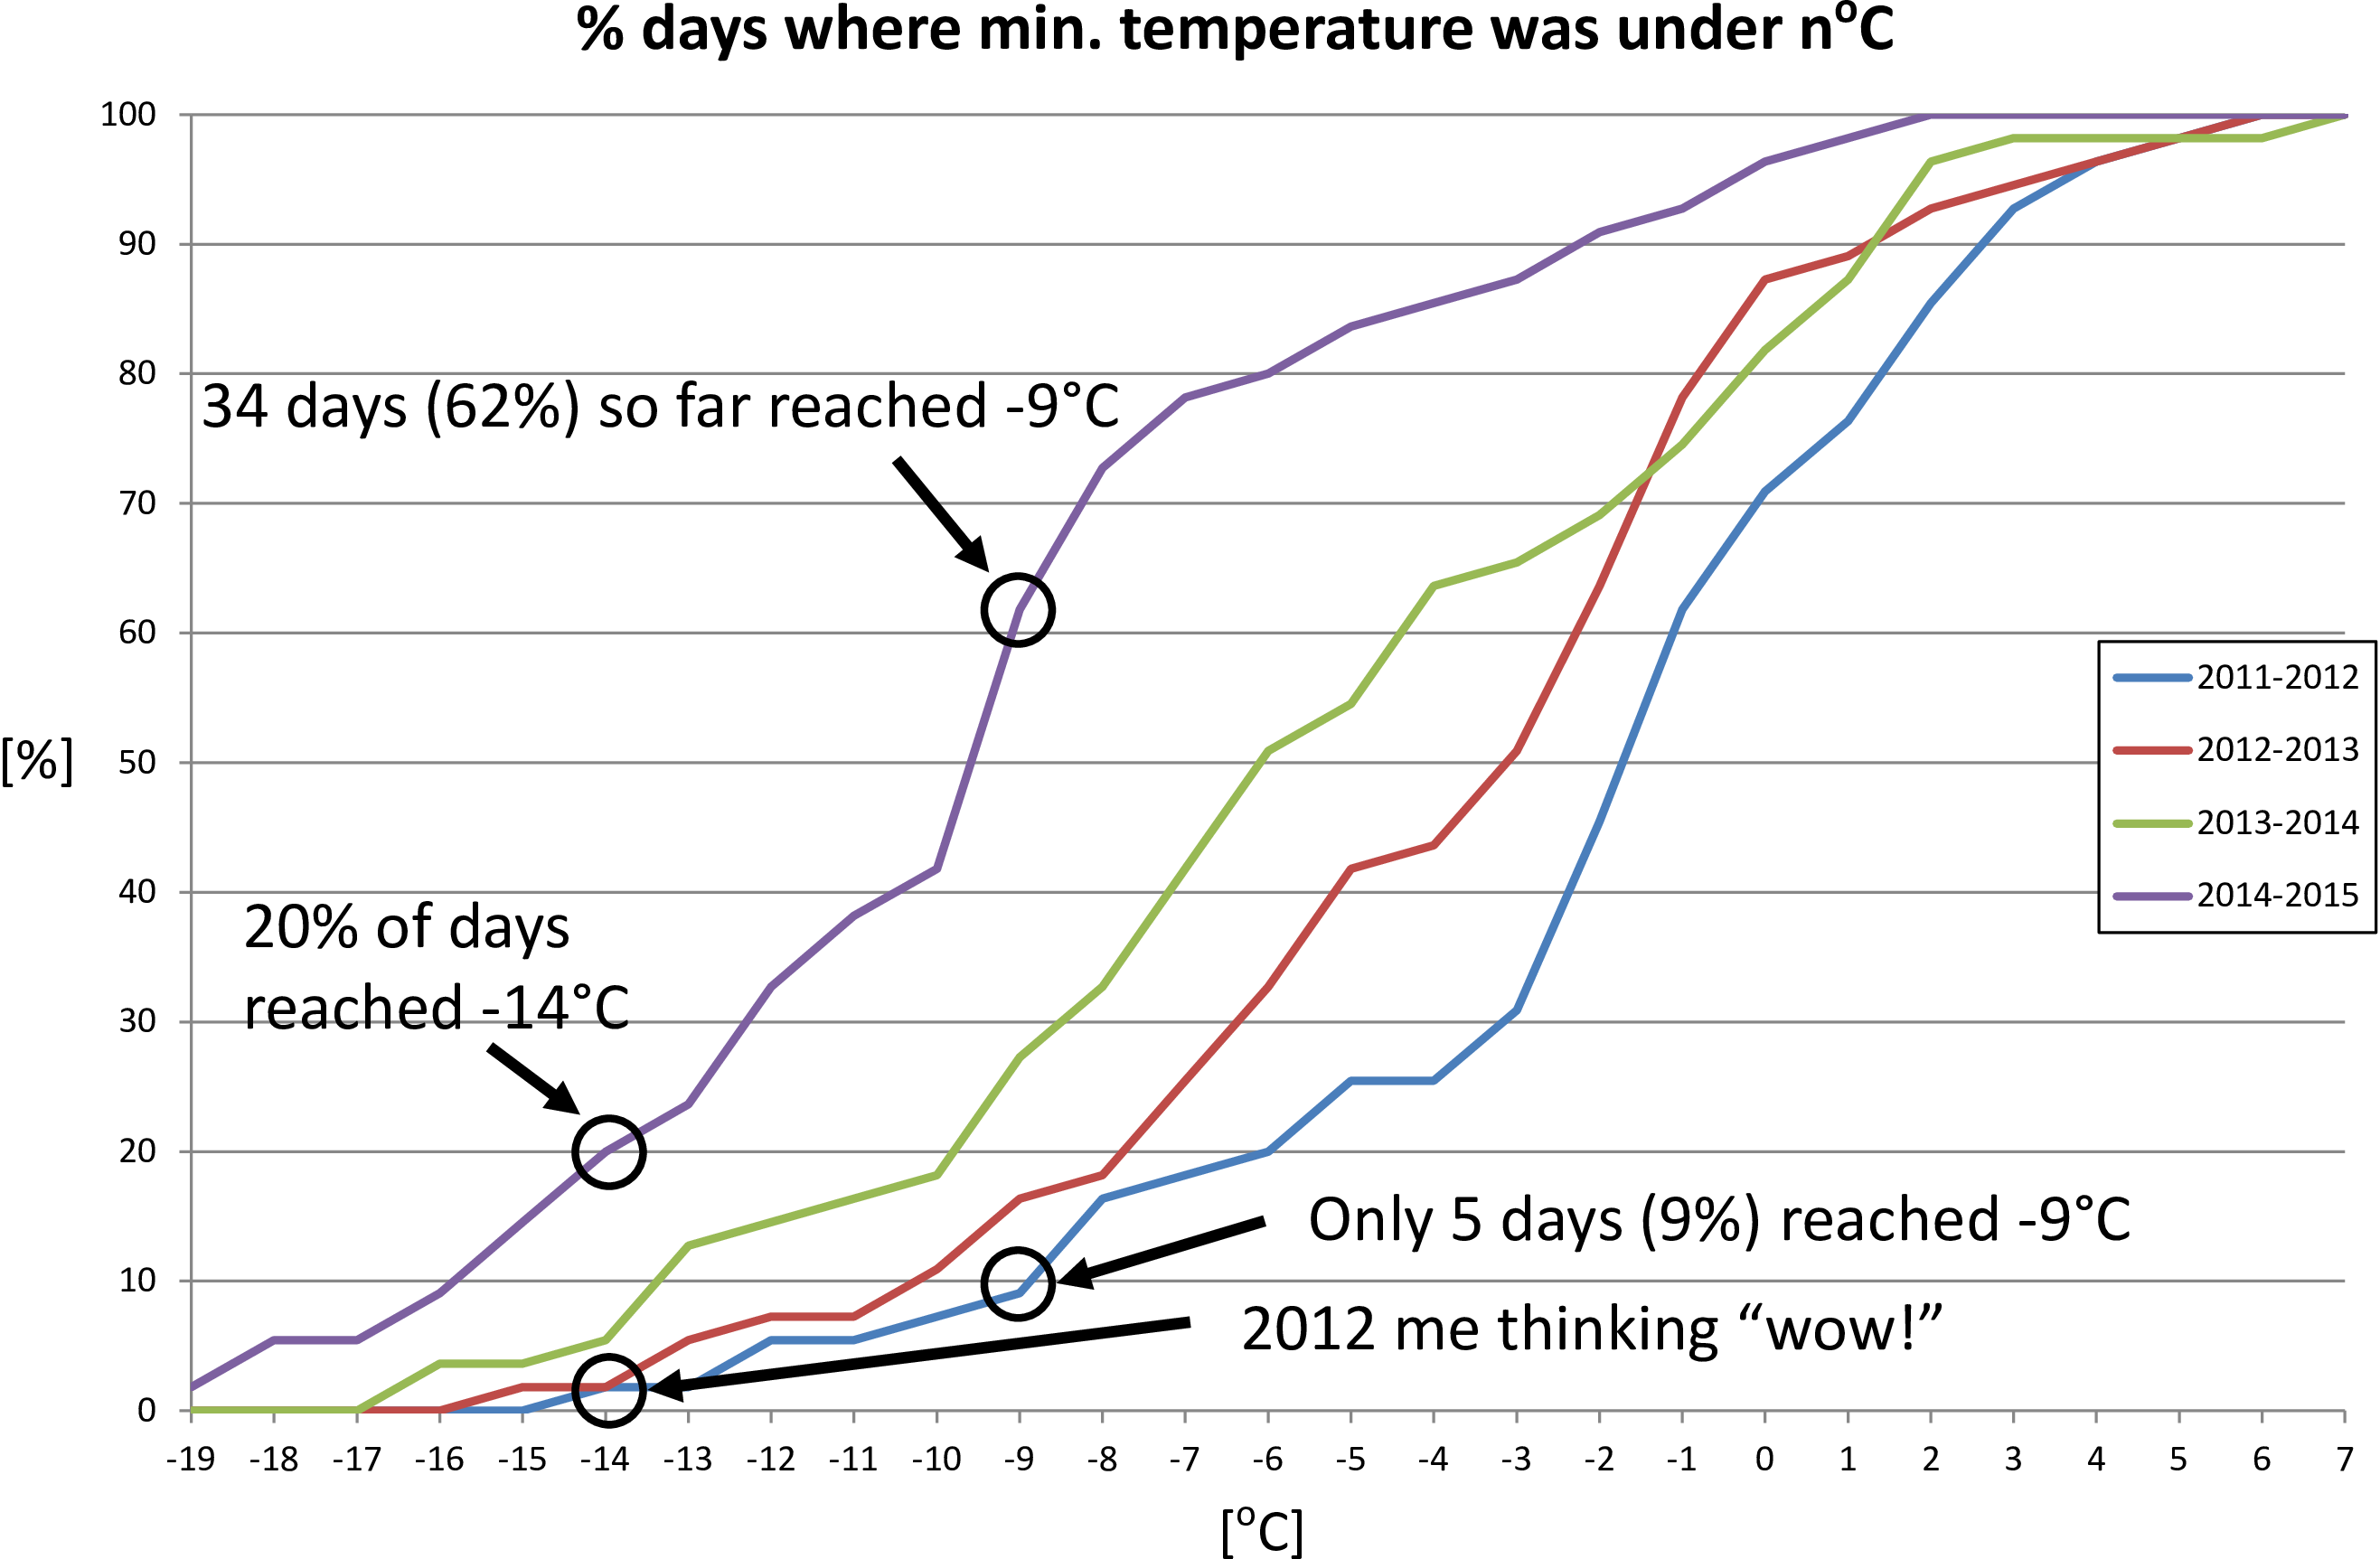
The plot shows the percentage of days where the minimum temperature was under a certain level, in Celsius. The further left, the more days got cold temperatures. The blue curve on the right is our first winter in Boston, and the purple one on the left is the current one. You can see that it did get a little bit worse every year. But this year is honestly pretty crazy. While there was only 1 day out of 55 (<2%) in 2012 at or under -14°C, this year we hit that mark 11 times already (20%). Similarly, while only 5 days in 2012 saw temperatures lower than -9°C, we’re already at 34 days in 2015, that’s 9% versus 62%!
Now you might say that minimum temperatures don’t count that much as they mostly happen in the middle of the night where people are inside their nicely insulated american homes (yes, I’m looking at you, Japan, with your temperatures that feel colder inside than outside!). Alright, so let’s look at the maximum temperatures. The plot shows the percentage of days that we joyfully spent under a certain temperature.
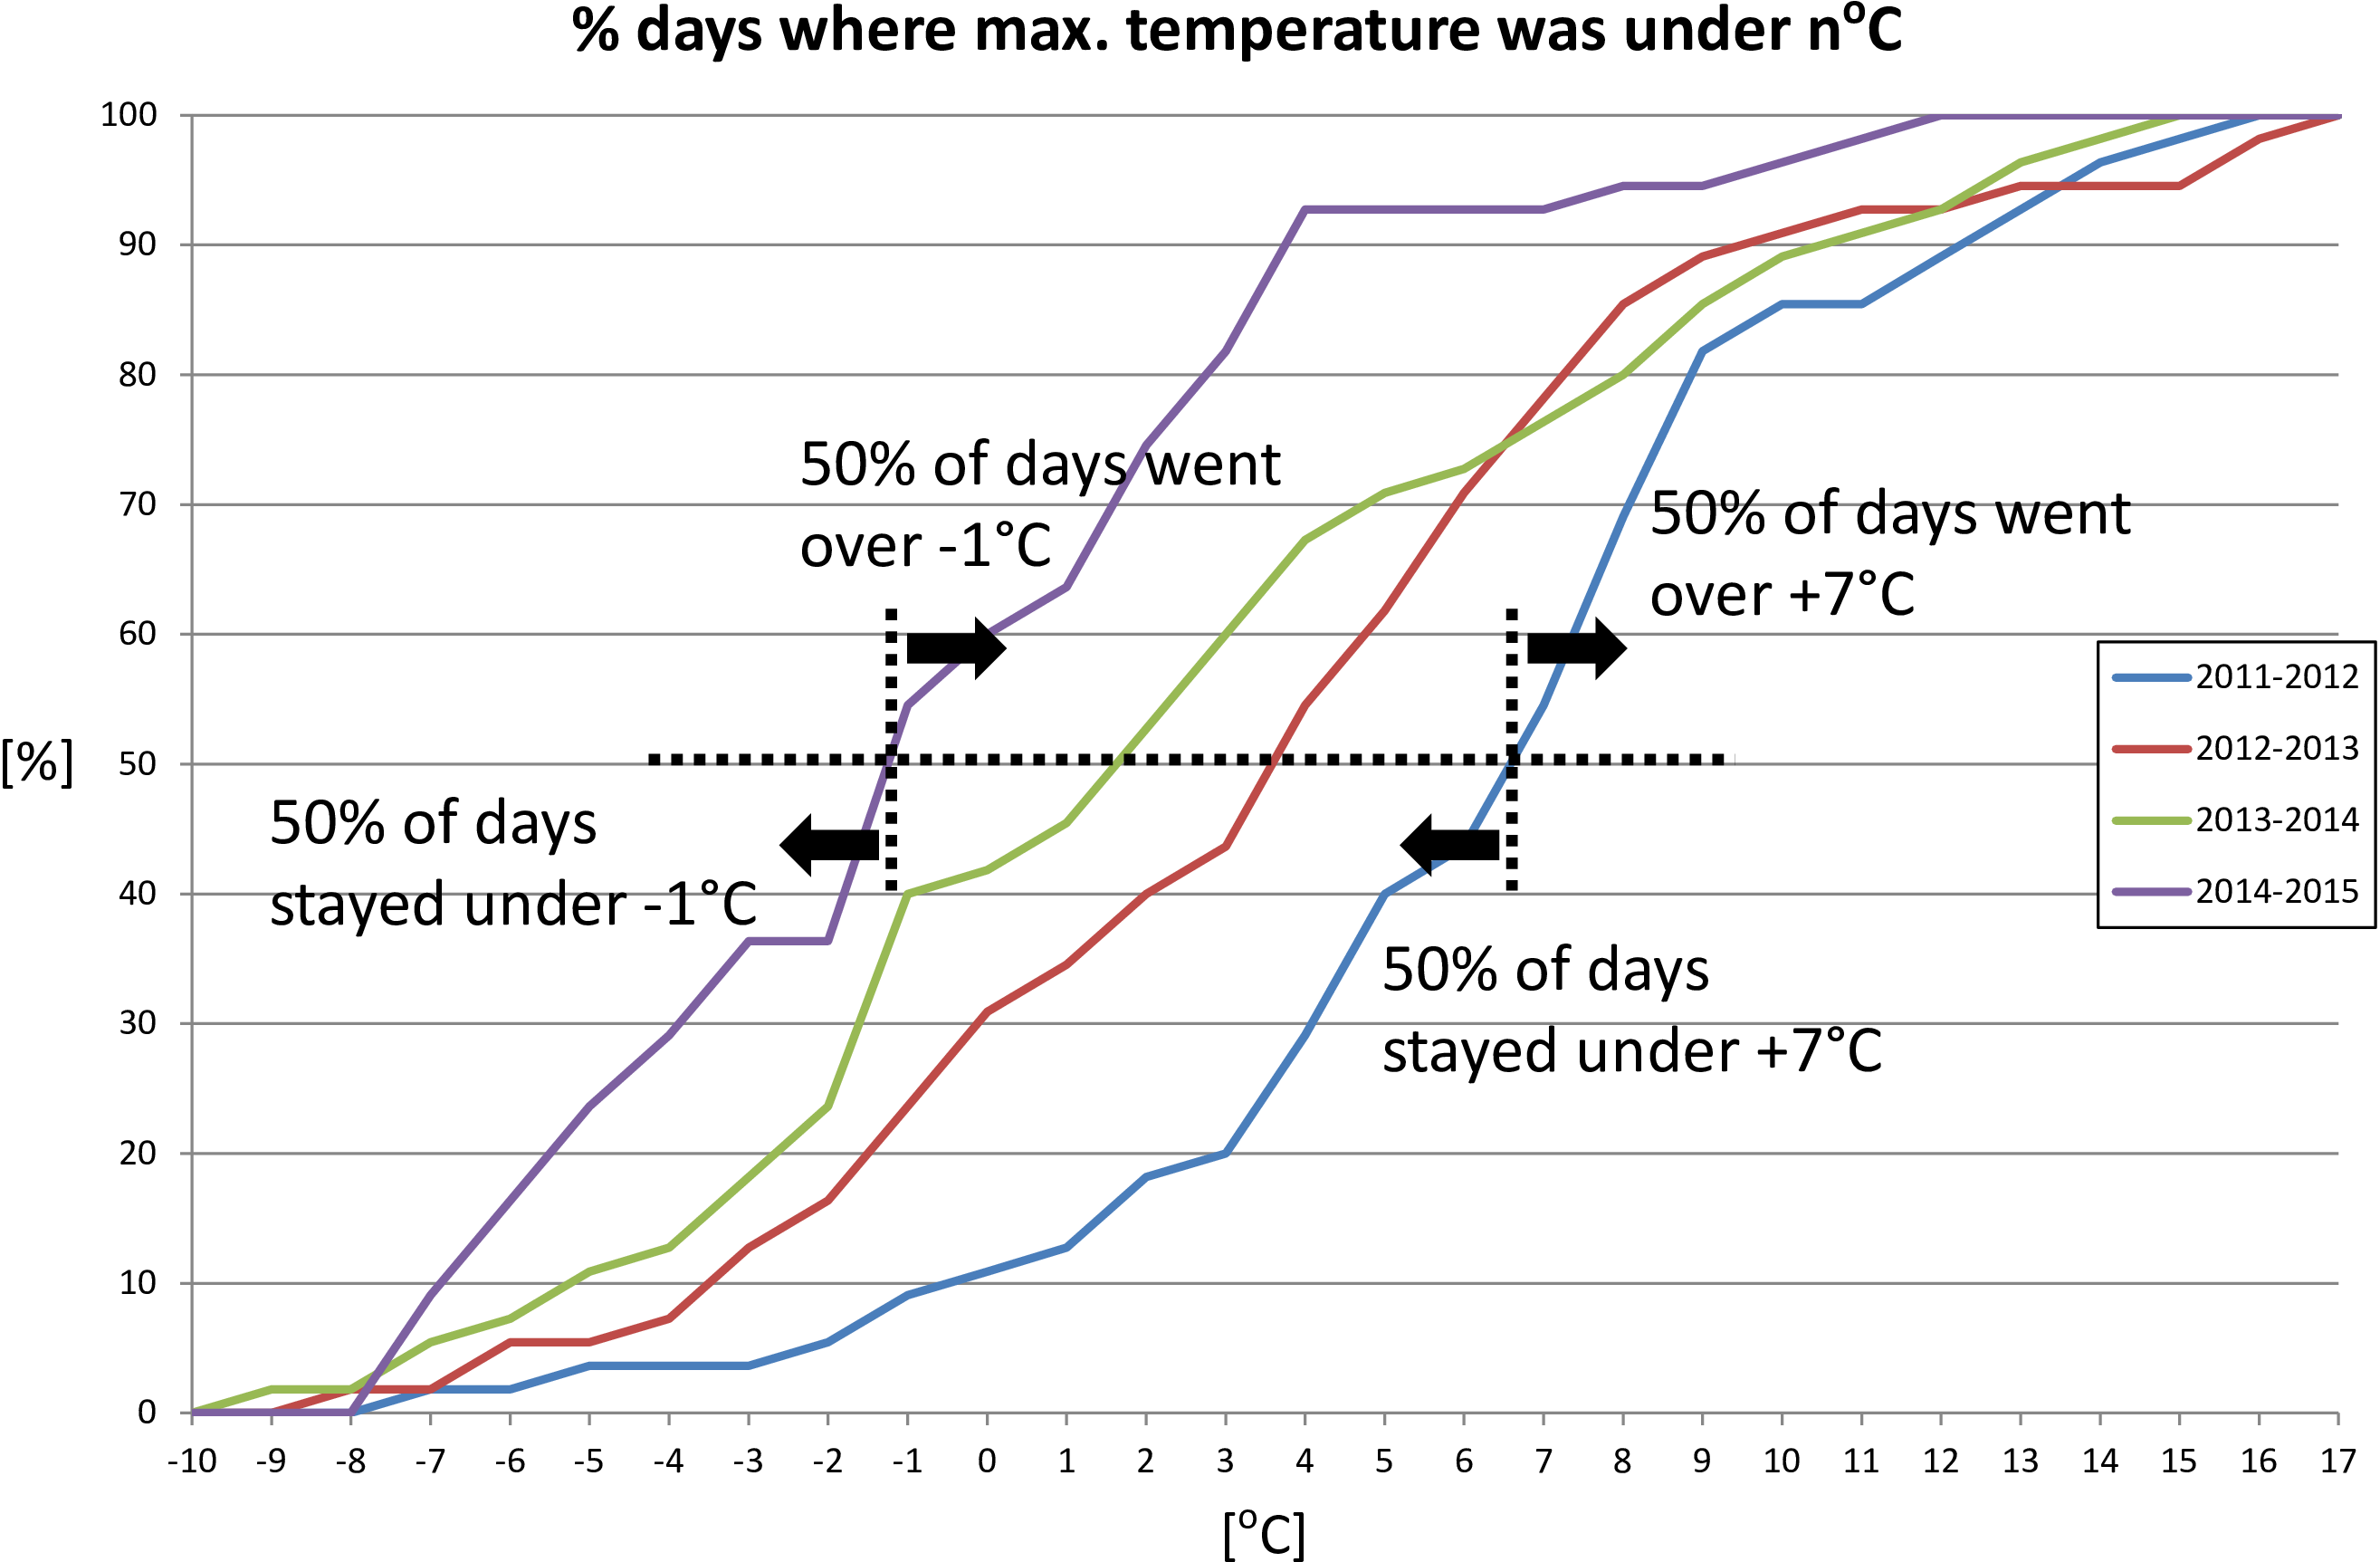
Just to give one number, we’ve spent 33 days out of 55 under 0°C this year, versus only 6 in 2012. Any way you look at it, my friend, we’re pretty miserable, especially if you consider that the few warm days this year all happened at the begining of January: we haven’t been over 4°C since… January 19.
Now the real problem with all the snow and the low temperatures is: how can I explain my 3 year old that we’re out of Christmas season and it’s time to stop singing “Jingle Bells”??
—
If you want to play with this kind of data, you can make a request for a particular set to the NCDC (requests can be granted within minutes, at worse a few hours later), or you can have a look at the raw data I used for Boston, from April 2011 to February 2015.