Analyzing the largest comebacks in the NBA

(Note: If you are here to play with the cool interactive plots and want to skip the lengthy chit chat, scroll down!)

Now that the NBA regular season is over and the playoffs are well under way, I thought I’d share some data analysis I did recently about the largest comebacks in NBA history.

The idea of looking at this came up this past March, during a conversation with Tommy Powers from UW (who will be spending the summer with us as an intern) at ICASSP 2017 in New Orleans. The Boston Celtics at Golden State Warriors game was for some strange reason shown on TV in a bar where we were listening to some great blues band. The Celtics were ahead in Q4 and ended up winning with a large margin, but we were wondering at which point it would become hopeless for the Warriors to stage a comeback.

I thought it’d be fun to have a plot that showed, for any given time in a game, the largest score deficit that a team was in and still ended up winning. For example, at half-time, what was the largest score deficit that a team ended up overcoming? You could imagine the curve starting at 0 at the beginning of the game (games usually start at 0-0), going down as minutes passed to some minimum, and then creeping back up, because with less time left to play, it becomes harder and harder to overcome a large deficit and win.

I poked around on the internet for play-by-play data logs, and thought I’d have to write a scraper to get the data from some sports website, when I stumbled upon some reddit thread mentioning that stats.nba.com  had an API from which the data could be accessed. Further googling with the magic word (“github”) quickly showed that (of course!) several people had already written some Python wrapper to do the heavy lifting. I decided to use statsnba-playbyplay, as it seemed to have the appropriate features.

A few (read: way too many) hours later, I was able to get the plots I wanted. They only cover the seasons from 1996-97 to 2016-17, because play-by-play data is not available for earlier seasons. I also arbitrarily decided to only consider regular season games, and to not show  overtime periods (of which I realized some games had many!).

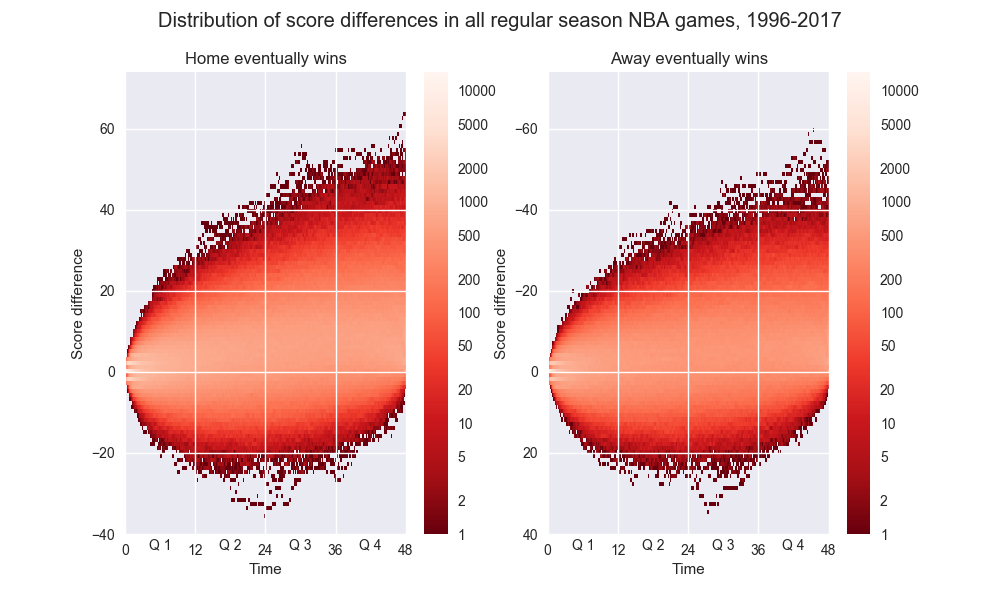
Without further ado, here are the results for the largest comebacks overall from 1996 to 2017, with separate charts for games where the home team eventually wins and games where the away team eventually wins. You can hover over the plots (made with plot.ly) to see the list of games that correspond to the largest comebacks at each second.


So the Utah Jazz were able to overcome a 36 point deficit against the Denver Nuggets in 1996, at home. Conveniently, the largest deficit occurred at half-time. The largest comeback for an away team goes to the Sacramento Kings, who ended up beating in 2009 the Chicago Bulls, in Chicago,  even though the Bulls were 35 points ahead after 3 and half minutes in the third quarter: the crowd must not have been pleased!

Here are plots showing each season separately (this may take some time to load):


It’s pretty clear by comparing all seasons how the Nuggets at Jazz and Kings at Bulls games were outliers. We can also look at the distribution of scores in all games from 1996 to 2017, to show how rare such large comebacks are:

Distribution of score differences in all regular season NBA games, 1996-2017
These two games, which you can see as the little crumbs at the bottom of each plot, are literally one in over 10,000 games!
Finally, here is a list of the largest home/away comebacks for each season and the corresponding games:
Score Game Date Time of largest score deficit
Season Home / Away
1996-97 Home -36 Denver Nuggets at Utah Jazz Wednesday, November 27, 1996 Q2 11’40” to Q2 11’56”
Away -27 Phoenix Suns at Dallas Mavericks Sunday, March 2, 1997 Q3 8’51” to Q3 9’32”
1997-98 Home -24 Chicago Bulls at Utah Jazz Wednesday, February 4, 1998 Q2 0’47” to Q2 2’28”
Away -24 Minnesota Timberwolves at Dallas Mavericks Saturday, January 17, 1998 Q3 6’7” to Q3 6’20”
1998-99 Home -23 Houston Rockets at San Antonio Spurs Sunday, April 18, 1999 Q2 1’4” to Q2 1’20”
Away -28 Los Angeles Lakers at Golden State Warriors Tuesday, April 20, 1999 Q2 2’22” to Q2 7’42”
1999-00 Home -22 San Antonio Spurs at Dallas Mavericks Tuesday, March 21, 2000 Q2 10’28” to Q2 11’39”
Away -23 Sacramento Kings at Los Angeles Clippers Saturday, March 18, 2000 Q2 3’29” to Q2 3’40”
2000-01 Home -24 Miami Heat at Sacramento Kings Sunday, December 10, 2000 at Q2 0’0”
Away -28 Sacramento Kings at Phoenix Suns Wednesday, March 7, 2001 Q2 8’36” to Q2 8’46”
2001-02 Home -23 Charlotte Hornets at New Jersey Nets Sunday, February 24, 2002 Q3 3’21” to Q3 3’25”
Away -25 Memphis Grizzlies at Portland Trail Blazers Monday, March 25, 2002 Q3 7’14” to Q3 8’39”
2002-03 Home -30 Dallas Mavericks at Los Angeles Lakers Friday, December 6, 2002 Q3 0’40” to Q3 0’57”
Away -23 Los Angeles Lakers at Memphis Grizzlies Friday, April 4, 2003 Q4 0’0” to Q4 0’13”
Away -23 Boston Celtics at Philadelphia 76ers Monday, January 20, 2003 Q3 1’10” to Q3 1’31”
2003-04 Home -25 New Orleans Hornets at Cleveland Cavaliers Monday, February 23, 2004 Q2 4’15” to Q2 5’34”
Away -29 Phoenix Suns at Boston Celtics Friday, December 5, 2003 Q3 0’23” to Q3 0’49”
2004-05 Home -22 Washington Wizards at Toronto Raptors Friday, February 4, 2005 Q3 3’40” to Q3 4’13”
Away -24 Los Angeles Clippers at Chicago Bulls Saturday, November 13, 2004 Q2 5’30” to Q2 5’41”
2005-06 Home -25 Charlotte Bobcats at Chicago Bulls Wednesday, November 2, 2005 Q3 3’22” to Q3 3’28”
Home -25 Boston Celtics at Miami Heat Thursday, March 16, 2006 Q2 8’37” to Q2 9’24”
Away -19 Los Angeles Clippers at Golden State Warriors Monday, January 23, 2006 Q3 8’10” to Q3 8’36”
Away -19 Philadelphia 76ers at Minnesota Timberwolves Sunday, January 22, 2006 Q3 10’2” to Q3 10’20”
2006-07 Home -27 New Orleans/Oklahoma City Hornets at Portland Trail Blazers Friday, November 10, 2006 Q2 0’20” to Q2 0’24”
Away -25 Seattle SuperSonics at Minnesota Timberwolves Tuesday, March 27, 2007 Q3 6’4” to Q3 6’17”
2007-08 Home -25 Portland Trail Blazers at Philadelphia 76ers Friday, November 16, 2007 Q2 8’20” to Q2 8’35”
Away -25 Denver Nuggets at Indiana Pacers Saturday, November 10, 2007 Q2 6’36” to Q2 6’48”
2008-09 Home -29 Minnesota Timberwolves at Dallas Mavericks Tuesday, December 30, 2008 Q3 1’34” to Q3 2’10”
Away -26 Philadelphia 76ers at Indiana Pacers Friday, November 14, 2008 Q2 0’26” to Q2 0’30”
2009-10 Home -24 Phoenix Suns at Indiana Pacers Wednesday, January 13, 2010 Q2 5’51” to Q2 5’58”
Away -35 Sacramento Kings at Chicago Bulls Monday, December 21, 2009 Q3 3’10” to Q3 3’26”
2010-11 Home -23 Sacramento Kings at New Orleans Hornets Wednesday, December 15, 2010 Q3 3’12” to Q3 4’8”
Away -25 Toronto Raptors at Detroit Pistons Saturday, December 11, 2010 Q3 6’9” to Q3 6’50”
2011-12 Home -21 Milwaukee Bucks at Sacramento Kings Thursday, January 5, 2012 Q2 10’1” to Q3 1’4”
Home -21 Los Angeles Lakers at Washington Wizards Wednesday, March 7, 2012 Q3 4’37” to Q3 4’49”
Away -27 Boston Celtics at Orlando Magic Thursday, January 26, 2012 Q2 8’49” to Q2 8’57”
2012-13 Home -27 Boston Celtics at Atlanta Hawks Friday, January 25, 2013 Q2 5’59” to Q2 6’14”
Away -27 Miami Heat at Cleveland Cavaliers Wednesday, March 20, 2013 Q3 4’16” to Q3 4’47”
Away -27 Milwaukee Bucks at Chicago Bulls Monday, November 26, 2012 at Q3 9’10”
2013-14 Home -27 Toronto Raptors at Golden State Warriors Tuesday, December 3, 2013 Q3 2’40” to Q3 2’48”
Away -25 Indiana Pacers at Detroit Pistons Saturday, March 15, 2014 Q2 8’36” to Q2 8’56”
2014-15 Home -26 Sacramento Kings at Memphis Grizzlies Thursday, November 13, 2014 Q2 1’14” to Q2 2’1”
Away -26 Golden State Warriors at Boston Celtics Sunday, March 1, 2015 Q2 5’7” to Q2 5’19”
2015-16 Home -26 Miami Heat at Boston Celtics Wednesday, April 13, 2016 Q2 11’1” to Q2 11’55”
Away -24 Chicago Bulls at Philadelphia 76ers Thursday, January 14, 2016 Q2 5’38” to Q2 5’55”
2016-17 Home -28 Sacramento Kings at San Antonio Spurs Wednesday, March 8, 2017 Q2 7’18” to Q2 7’26”
Away -24 Memphis Grizzlies at Golden State Warriors Friday, January 6, 2017 Q3 6’44” to Q3 7’19”

If you feel like playing with the data, I put both the code and the data on github. Here is how the code looks like:

That’s it!


(Sort of) offsetting our carbon footprint

Hi there! It’s been a while!

Given that today is Earth Day, I thought I’d finally take action on something that has been on my mind for quite a while: offsetting in some way (part of) our family’s carbon footprint.

We travel quite a bit, to visit family or go on vacation, and I feel guilty every time I fly. And although we do now have solar panels that cover virtually all our electrical needs, we do rely on propane to heat our home. That’s definitely not 100% of our whole impact, but I hope that’s already some chunk of it.

So I decided to proceed in two steps:

  • Calculate an estimate of our carbon footprint (for 2016, I plan on doing this every year)
  • Figure out how to offset it: it turns out this is not so simple.

The first step is easy: there are plenty of tools out there. I picked this one, and used the House, Flight, and Car tabs. I (of course) counted flights for the whole family, and included business trips for myself.

It only took a few minutes to get this:

  • Flights: 33.73 metric tons of CO2. At roughly $13/ton, that’s $450.
  • House: In 2016, we bought 707.3 Gallons from our propane company (this number can be easily found on each bill). At 5.7 metric tons of CO2 per 1000 gallons, that’s about 4 metric tons, so $52.
  • Car: I proudly drive an e-golf, but we still have a gas-powered minivan to haul the family. We roughly drove 4000 miles on that car last year, which gave me 1.43 metric tons in the calculator above, so $19.

Grand total: $521

Now to the key part: how do you offset your carbon footprint? There are many diverging opinions on the worthiness of carbon offset initiatives, and I haven’t been able to figure out whether using carbon offset programs is really guaranteed to result in a real impact in the long run. So here is what I decided to do: I didn’t “offset” my carbon footprint per se, but instead donated the money to environmental organizations. I hope that these organizations will make good use of this money to fight global warming and other environmental issues at a greater scale.

Here is my pick:

They all have Donate buttons that are very easy to find. I shared the money evenly among them.

Not that hard, right? I hope some of you will be inspired to do the same! If you do, or if you have any suggestions/comments, feel free to drop me a note 🙂


Tidying up my (data) mess

I’ve recently bought a NAS (network-attached storage), with the main goal of making it as easy as possible to actually enjoy our collection of photos and home videos instead of only amassing them, never to be watched again.

Of course, a big part of this is to clean up the data first, once and for good, and that is, no wonder, a major endeavor (which is the very reason why I kept kicking the can down the road all these years!). With three children under 3, you may wonder how come I have spare time to take care of this. The answer is simple: I don’t. I have been working on this for several weeks late at night, which is probably one of the main reasons why it took my tired brain so long to figure many important things out.

It’s still a work in progress, but I thought I’d share a few tricks that I’ve used and that required a lot of searching and fiddling around before I could get them right.

Things would be much easier if I wasn’t borderline (?) OCD and I didn’t spend hours fixing time issues (wrong time zone, cameras out of sync) in my photos and home videos. Even worse, my photo library (26000 pictures and counting) was managed in iPhoto ’11 (9.2.3, running on Snow Leopard… I know, time to update), so I had to find a way to export everything without losing the time adjustments I had made in there as well as other metadata (Faces info for example, although it’s not clear whether other software can handle those).

I have been using a combination of several tools:

  • iPhoto: over the years, I fixed a lot of timing issues through the “Adjust Time” option of iPhoto, but somehow never clicked the “Modify the originals” checkbox. I thus had to select my entire library, add 1 second (without modifying the originals, because it takes forever and is useless!), then remove 1 second, this time checking the Modify the originals box. I actually did it on smaller batches, because it does not take much for iPhoto to crash…
  • phoshare:  this is an open source software written in Python that exports images from iPhoto/Aperture while preserving metadata. Here is a great tutorial (and here’s another) on how to use Phoshare. I modified the code so that the exported images could be renamed according to both the date and the time they were taken (the original code only handles the date).Of course, I later realized that I could have spared myself the trouble by simply exporting the pictures with their original names, and do the automatic renaming using either exiftool or Adobe Bridge as explained below. Anyway. If you are still interested in using the modified version, download my version of imageutils.py and put it in Contents/Resources/lib/python2.7/tilutil/ in place of the old one (you need to right-click the application and choose “Show package content” to access those files). Then you can use {hh}{MM}{ss} in the file name template for hours, minutes and seconds.
  • exiftool: this is a nifty piece of software that can do all sorts of crazy things on/using the EXIF data of a photo. I used it to set the modification date/time of all my photos to the date/time they were taken. This is done in one line:
    exiftool "-DateTimeOriginal>FileModifyDate" folder_name/
    and it even goes down recursively in subfolders, hurray!
  • GNU touch: for videos, as well as pictures for which the EXIF data was too messy, I resorted to using the command line (I’m on a Mac, but it works the same on Cygwin on Windows) and the good old GNU touch. This actually took me quite a while to understand, because resources online were pointing at obsolete syntax (“use -B n to go back n seconds!”… nope). It looks like touch’s syntax was completely changed in the last few years, and for the better. The -d switch is pretty magical, and lets you set the modification time of a file to a specific date, where the format of the date is pretty much anything that makes sense! In combination with -r file1, you can grab the modification time of file1 and apply it to another file after adding or subtracting an arbitrary amount of time, e.g.:
    touch -r file1.avi -d "-1hour-2minutes3seconds" file2.avi
    will set file2.avi’s modification time to 1 hour 1 minute and 57 seconds prior to that of file1.avi. You can of course use it as touch -r file1.avi -d "6hours" file1.avi for example to account for a +6 hour time zone difference, which is what you need when taking pictures in France with a camera set to Eastern Time. Surprisingly, it is very hard to find documentation of the time-shifting aspect of -d, so I hope this helps someone out.
  • Adobe Bridge: I used it to automatically rename files according to their modification date, e.g. DSC00100.jpg renamed to 20130901_175959_DSC00100.jpg. I could have done this with exiftool, but I happened to have it and it’s very easy to deal with file batches.

Now that I’ve prepared all this data to put on the NAS, there are still a couple minor things that need to be dealt with, namely:

  • backing up the whole thing. Multiple times.
  • making it easy to watch on the TV.

For backup, I use two 2TB WD Passport drives: I keep one in a remote location, and have the NAS back up on the other one every couple days. My plan is to swap the drives between home and the remote location every couple weeks. I also started using Google Drive, and subscribed a 1TB plan ($10/month). I uploaded all home videos and photos, making sure to use the Google Drive app, and NOT drag-and-drop folders into Chrome: I tried that first, and it reset all the modification dates to the day of the upload, so that I ended up with dozens of home videos from 5 years ago that were showing up as if they’d been taken last week. Google Drive has the benefit of being both a backup, and an easy way to share media with the family. Plus, their auto-awesome feature is really cool. Going full-on Google, I also uploaded my music collection to Google Music: it’s free up to 50,000 songs. Yes, fifty bloody K. That’s a pretty ridiculously large music library, and more than enough for me.

As for watching, I’ve been toying with OpenELEC on a Raspberry Pi, a small Linux distribution that runs the Kodi media center. I use a Flirc IR receiver together with a Harmony programmable remote to control it as just another appliance. The result is impressive, kind of like browsing Netflix but with your own media library. It’s amazing what you can do with a $35 tiny computer (plus $9 for the case…). But I’ll soon get back to that.

It can only get better from here (right?)

When we arrived in Boston in April 2011, we were told that a pretty rough winter with a lot of snow had just ended. We prepared ourselves to go through some hard times come December or January, but we proudly vanquished our first winter in Boston, 2011-2012, patting ourselves on the back saying “we can totally do this, it’s not as bad as they say”. Still, I remember feeling some excitement the day we reached a minimum temperature of -14°C (or 7°F), and thinking “wow, -14°C, this is something!”.

Well, wait a second, myself of January 2012.

That winter was on the milder side, and every year since then has been getting a little bit worse. Until this year, where the weather apparently just decided to give us a run for our money.

By now, you’ve probably heard about the ridiculous amount of snow that has been piling up around Boston, and in particular in my driveway, through storms after storms. Always on weekdays, because you know, it wouldn’t be fun if the kids didn’t have to skip school and be entertained at home. At this point, Boston is at 104.1″ (2.64 meters…) and, guess what, it’s snowing right now! This is already the second snowiest season of all time, and we should hit number 1 easy peasy in the next few days.

So snow is one thing, but I got to think again about January 2012’s me clamoring “wow, -14°C, this is something!”. As I was watching the weather reports recently, I felt like I was seeing a lot of pretty low numbers, with minus eighteens here and there (that’s without the windchill…), to the point where everybody just became pretty casual about it. So I decided to look it up, to make sure that my 2012 utter shock at the -14°C mark was a mere lack of truly Bostonian perspective and experience.

To do so, I requested the relevant data from the National Climatic Data Center (NCDC), and did a simple analysis of the minimum and maximum temperatures at Boston Logan International Airport (the reference weather station in Boston) from January 5 to February 26, each year from 2012 to 2015. The range is pretty arbitrary: January 5 is the day we came back from France this year, and February 26 is the day of the latest available data. So, basically, I’m trying to compare the pain we (me and my family, completely selfishly) have endured so far this winter to that of past years.

Without further adue, here is an illustration of the minimum temperatures that we’ve been getting:

The plot shows the percentage of days where the minimum temperature was under a certain level, in Celsius. The further left, the more days got cold temperatures. The blue curve on the right is our first winter in Boston, and the purple one on the left is the current one. You can see that it did get a little bit worse every year. But this year is honestly pretty crazy. While there was only 1 day out of 55 (<2%) in 2012 at or under -14°C, this year we hit that mark 11 times already (20%). Similarly, while only 5 days in 2012 saw temperatures lower than -9°C, we’re already at 34 days in 2015, that’s 9% versus 62%!

Now you might say that minimum temperatures don’t count that much as they mostly happen in the middle of the night where people are inside their nicely insulated american homes (yes, I’m looking at you, Japan, with your temperatures that feel colder inside than outside!). Alright, so let’s look at the maximum temperatures. The plot shows the percentage of days that we joyfully spent under a certain temperature.

Just to give one number, we’ve spent 33 days out of 55 under 0°C this year, versus only 6 in 2012. Any way you look at it, my friend, we’re pretty miserable, especially if you consider that the few warm days this year all happened at the begining of January: we haven’t been over 4°C since… January 19.

Now the real problem with all the snow and the low temperatures is: how can I explain my 3 year old that we’re out of Christmas season and it’s time to stop singing “Jingle Bells”??

If you want to play with this kind of data, you can make a request for a particular set to the NCDC (requests can be granted within minutes, at worse a few hours later), or you can have a look at the raw data I used for Boston, from April 2011 to February 2015.

5 years later

Almost 5 years have passed since my last post on De l’origine du monde/手酌, the blog I used to write in Japanese and French about  life as a student-then-post-doc in Tokyo.

5 pretty life-changing years to say the least. Married, 3 children (a boy and twin girls), and a relocation to Cambridge, Massachusetts, where I work as a researcher in the Speech & Audio Team of Mitsubishi Electric Research Labs (MERL).

Many times I’ve wanted to share again some random thoughts, and the sad truth about why it took me so long to just do it is that I was kind of hoping to salvage my old blog, export it into WordPress and take it from there. It turned out to be too much pain, and after several precious nights wasted here and there over a period of two years trying to make things work, I finally decided that the right thing was to start afresh.

So here I am, all WordPressed and excited, ready to get the LaTeX plugin cracking or to tell you about my latest snow shovelling adventures (aka The joys of home ownership in New England).

I may or may not write some entries in French and/or Japanese, but for the time being I plan to use English as the main language. Larger audience, less work, I like that.

Ah, the blog title. I could spend another couple months trying to find a clever title, but I’m tired of postponing, so I went for now with “Chokotto” (ちょこっと), Japanese for “a little bit”. I plan to talk a little bit about this and that, plus, well, it sounds cute.

Alright, now the big question is: how long until the next post?